See More Than Just Marks

Child’s Academic Progress Graph View

iSchoolCloud gives parents a clear visual of how their child is performing across terms — no more guesswork or delayed updates.
school-logo
school-logo
school-logo
school-logo
school-logo
school-logo
school-logo
school-logo
school-logo
school-logo

Not Just Scores — A Full Picture of Progress

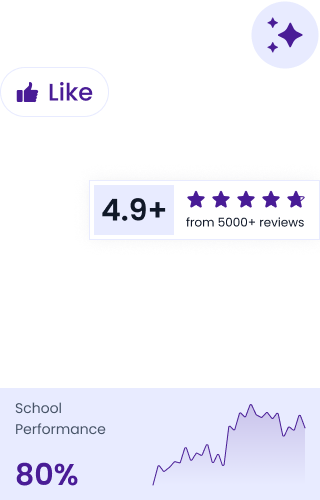
Report cards give numbers, but not trends. With iSchoolCloud, parents see how their child is doing — what’s improving, what needs focus, and how they’ve grown across time.

All shown in a clean, simple visual format you can understand in seconds.
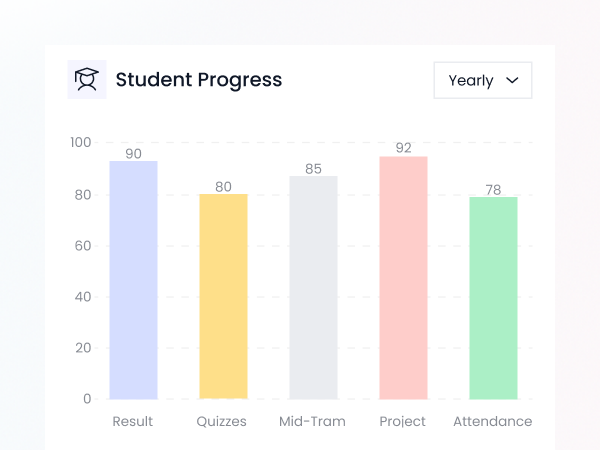
📊
Term-Wise Graph View
See how marks change across terms or exams.
📚
Subject-Wise Breakdown
Spot strengths and focus areas instantly.
📈
Clear Visual Format
No clutter — just simple, easy-to-read graphs.
🕒
View History at a Glance
Look back across academic years for long-term insights.
🔁
Auto-Updating with Every Exam
New marks update your child’s chart in real time.
📲
Mobile Friendly Interface
Check progress from your phone — anytime.
👩‍🏫
Optional Teacher Comments with Graphs
Get short context for score dips or improvements.
🧒
Each Child’s Graph on One Profile
For parents with more than one child — separate graphs, one app.
🔐
Private and Secure Access
Only visible to authorized parent logins.

Marks matter. But progress tells the real story.

iSchoolCloud’s progress graph gives parents more than just numbers — it shows patterns, growth, and areas that need care.

With clean visuals and real-time updates, you can:

Track how your child is improving

Spot struggles before they become problems

Talk to your child with facts, not guesswork

Support learning with awareness — not pressure

Whether your child is doing well or needs help, this feature helps you see where they’re going, not just where they’ve been.

It’s peace of mind — made visual.


It’s not about a number — it’s about growth.

See the Progress. Understand the Pattern.

Here’s what parents usually ask about progress graphs in iSchoolCloud.

The graph pulls real exam and term marks added by teachers and school staff.

Yes — subject-wise view lets you compare across exams easily.

Yes. You can switch between months, terms, or full academic year.

Yes — you can save or download the graph as a PDF or image.

If your school enables it, you’ll see teacher insights with each data point.

It depends on the school — but most graphs include exams, class tests, and term evaluations.

Each child has a separate view — you can switch easily but they stay organized.

Every graph is designed to be simple, with labels and legends. You don’t need to “read data” — just see the trend.

Yes — you’ll get an alert and can view the updated graph instantly.

Yes — completely private and visible only to authorized parent profiles.

Clarity Helps Parents Support Better

Let’s help your school share progress — not just scores — with parents.